
US Election Simulator for Miami users
If you follow politics from Miami, Florida, US Election Simulator gives you a hands-on way to study 2026 election maps, test scenarios, compare control odds, track polling context, and explore the state, county, primary, governor, Senate, and House views that make elections worth following.
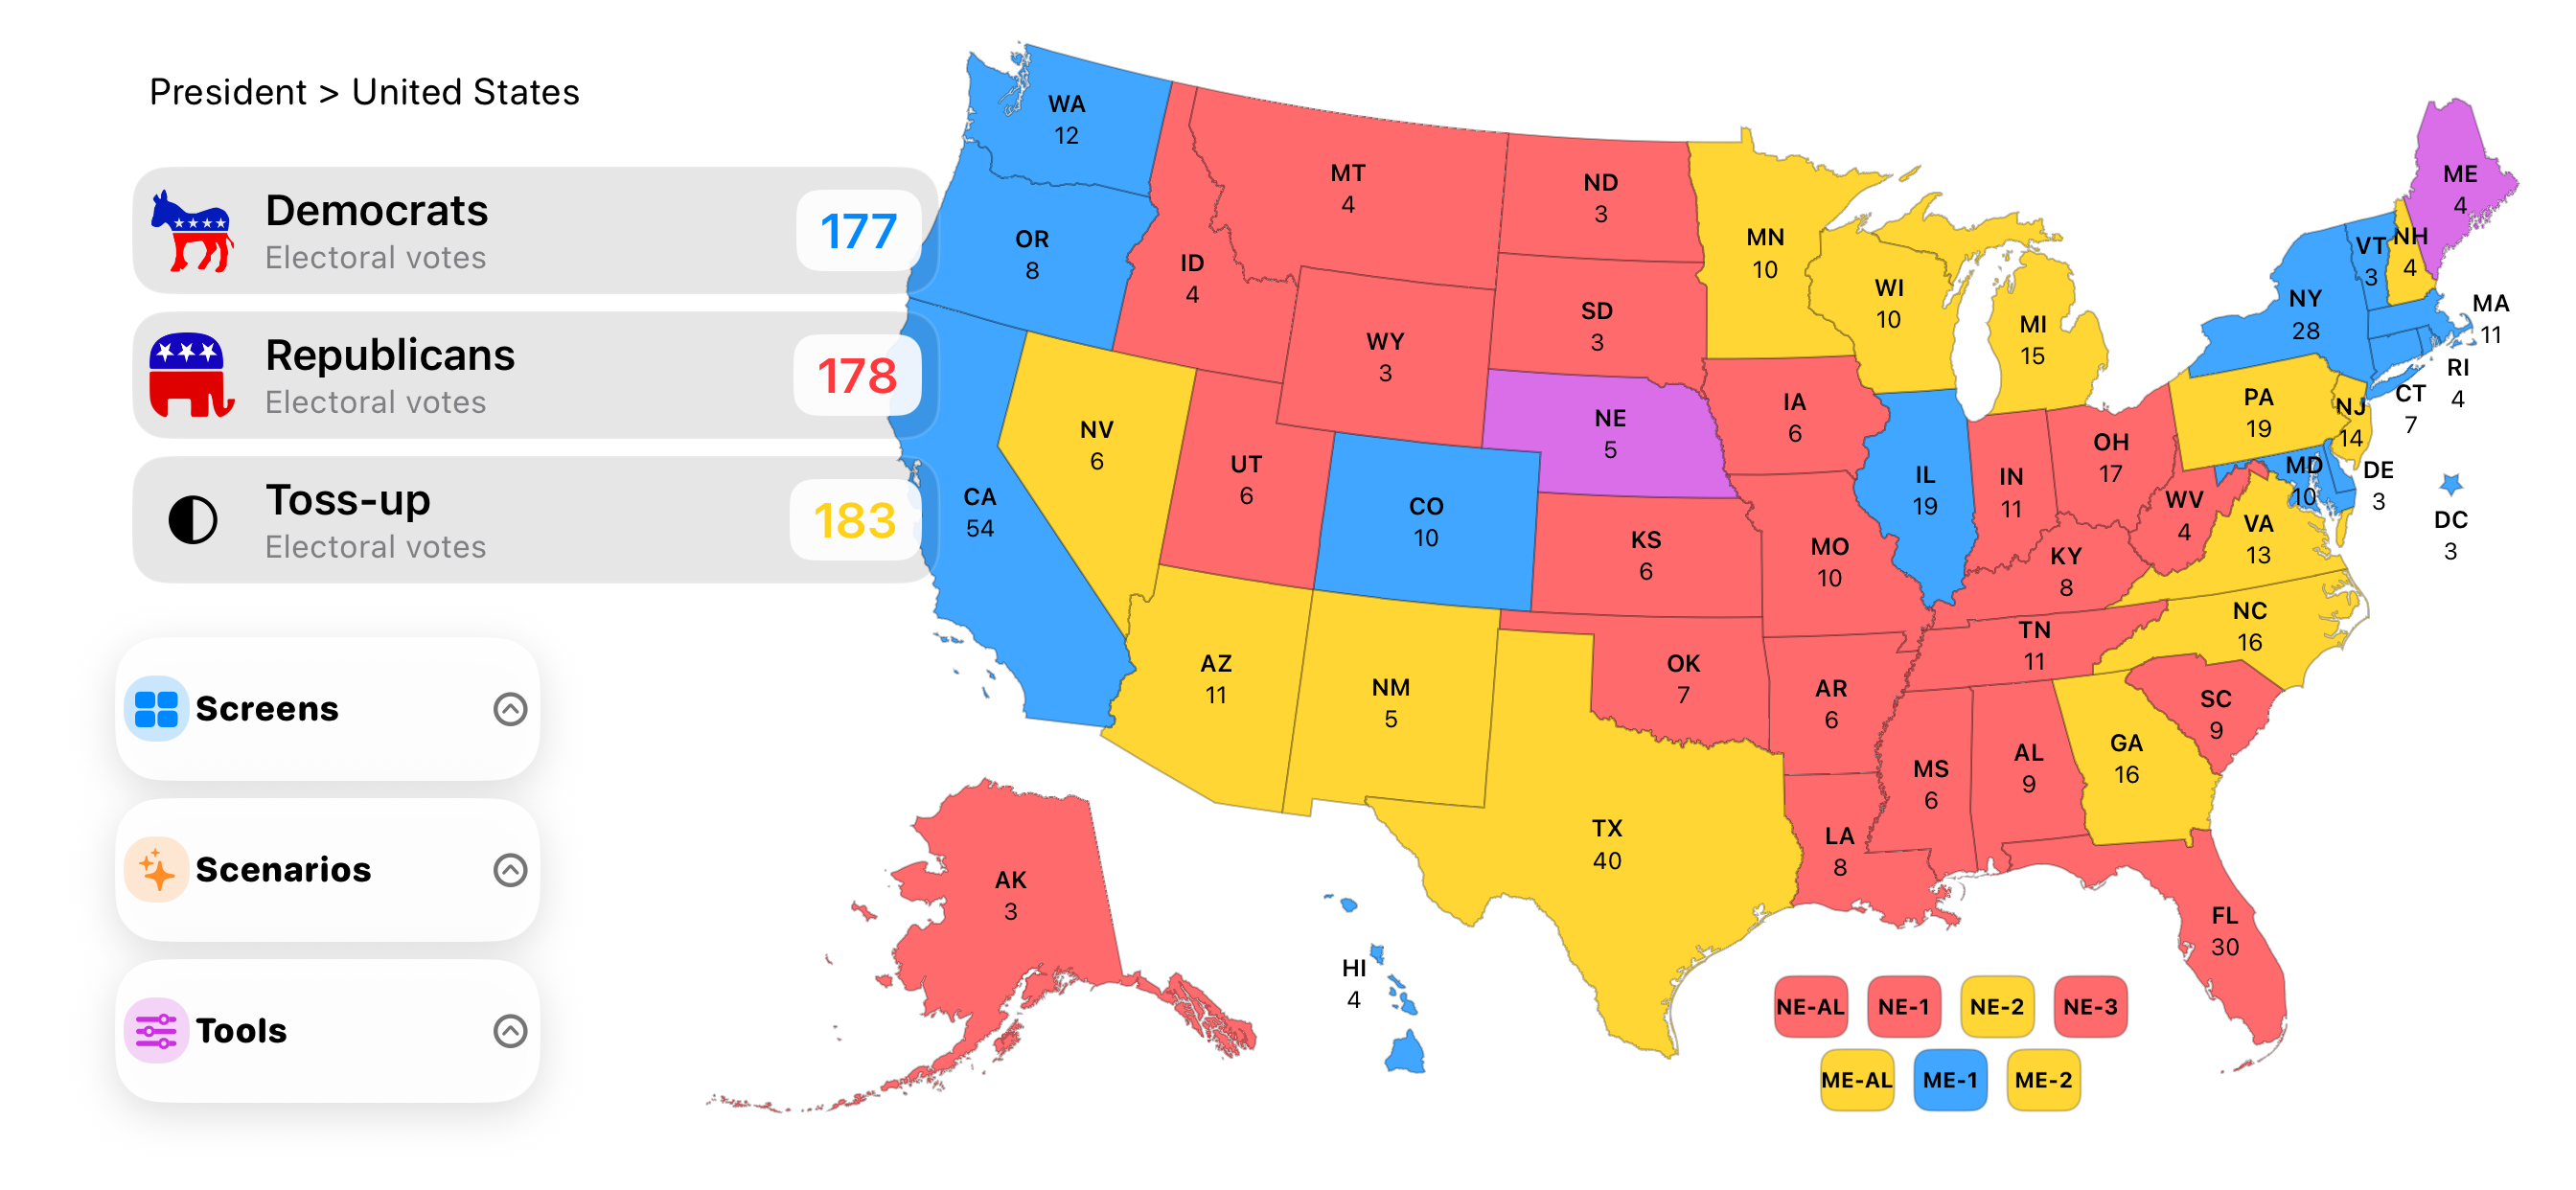
For people who want to understand the map behind the headline.
People in Miami who follow politics often want more than a single forecast number. The app lets you work through the map yourself: compare presidential outcomes, study battleground movement, check chamber control paths, and see how a scenario changes when one race or state shifts.
Instead of bouncing between articles, social posts, polling tables, and cable-news graphics, you can use one app to move from the national picture to the local details that explain the result.
- Check the race for 270 and compare presidential maps quickly.
- Explore 2026 Senate, House, and governor maps with toss-up and party-count views.
- Use Senate and House model screens to test control odds and seat paths.
- Review Daily Summary, Daily Odds, race headlines, polling context, and approval tracking.
- Create shareable map cards for messages, social posts, and your own analysis.
Maps for the whole race
Explore President, History, 2026 Senate, 2026 House, 2026 Governors, Democratic primary, and Republican primary screens from one election workspace.
Models and odds
Compare model outputs, Senate odds, House control paths, and market context to understand how different signals line up.
Election-night exploration
Use election-night style tools to think through state calls, close races, county returns, result drops, and scenario changes as the map evolves.
Useful before the race, during it, and after the votes are in.
Use the app before a debate to preview scenarios, during a campaign to follow polling and odds, and after results come in to revisit counties, margins, and state-by-state movement. Recent iPad and iPhone improvements make the deep feature set easier to navigate with breadcrumbs, cleaner menus, and better screen spacing.
- Fast map navigation with breadcrumbs on major screens
- Readable bottom-menu tools for screens, scenarios, maps, and options
- Optimized iPad portrait and landscape layouts
- Static map elements designed to reduce accidental changes while exploring
Why might someone in Miami use it?
Because political coverage becomes more useful when you can test the map yourself. You can compare assumptions, follow control paths, and decide which outcomes look plausible.
Is it only for election experts?
No. It is approachable for curious voters, but deep enough for people who regularly follow polling, margins, county shifts, and model movement.
What makes it different?
It combines maps, models, primaries, governors, polling, odds, daily analysis, shareable cards, and election-night scenario tools in one iPhone and iPad app.