2026 maps
Explore Senate, House, Governors, and presidential maps with party counts, toss-ups, and the ability to shape scenarios.

US Election Simulator gives the 2026 race a place to live in your hands: interactive Senate, House, Governors, President, primary, and history maps alongside models, Daily Summary, Daily Odds, and your own shareable scenarios.
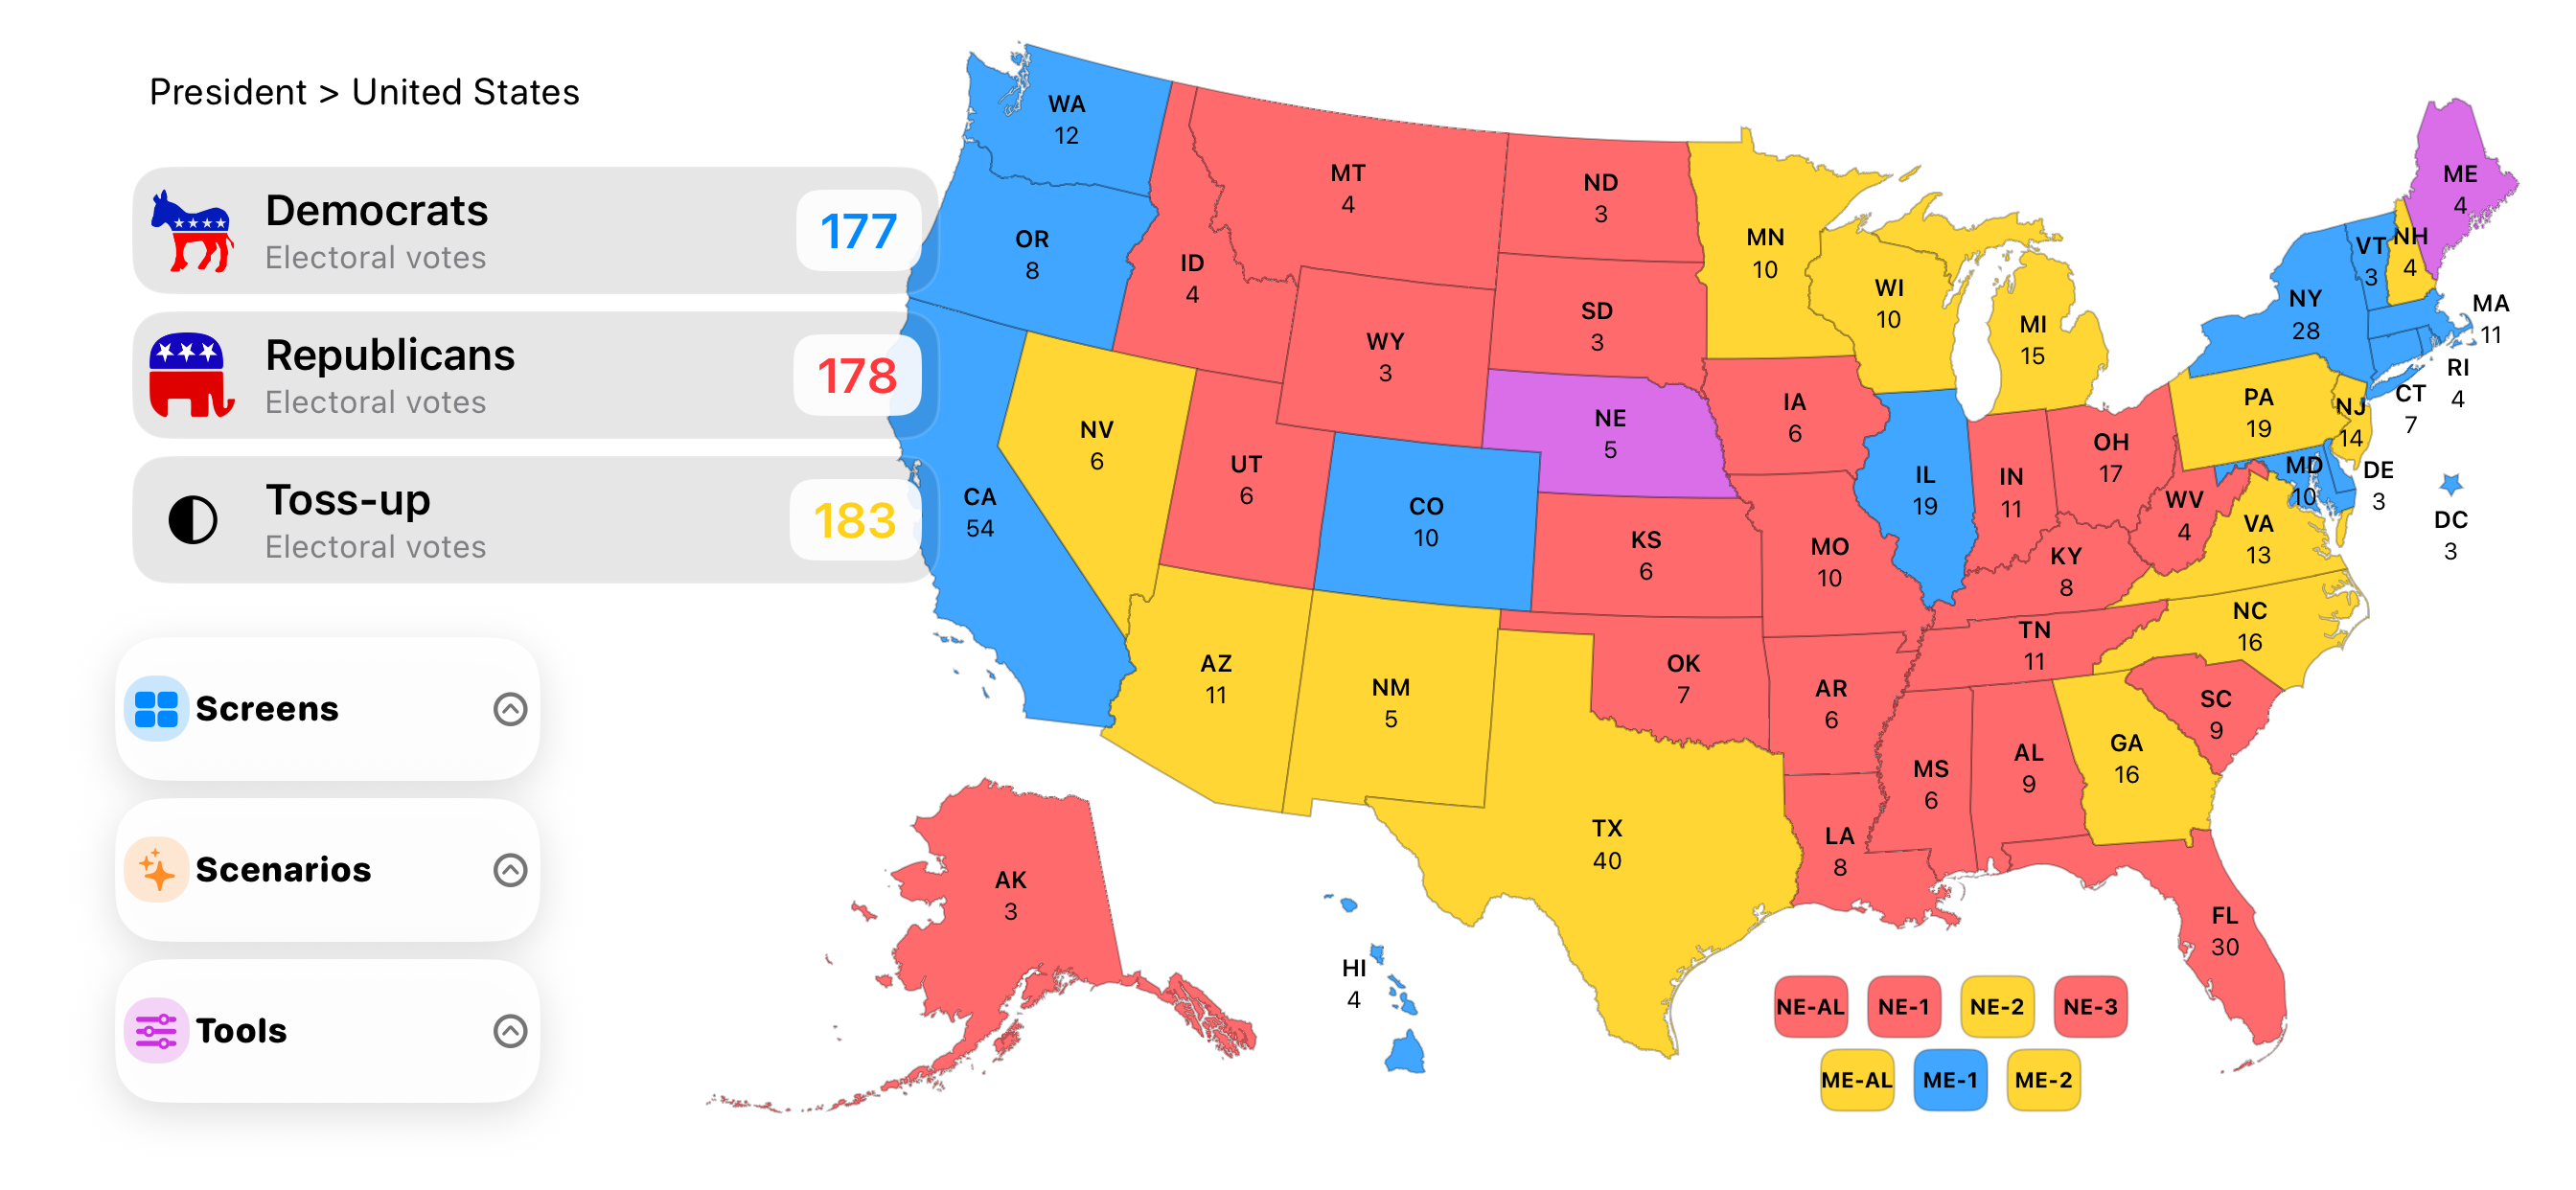
Move from the big picture to a single contest without bouncing between tabs, articles, and static graphics. The app gives you a hands-on way to understand how control changes, how assumptions shape a map, and why one closely watched race can matter so much.
See the national picture, change a scenario, visit the history, compare chambers, and keep going until the map makes sense. US Election Simulator is built for students, educators, analysts, campaign watchers, journalists, and anyone who learns best by trying the idea themselves.
Each space answers a different kind of election question, but the tools stay connected so it feels natural to keep exploring.
Explore Senate, House, Governors, and presidential maps with party counts, toss-ups, and the ability to shape scenarios.
See state and district probabilities, control odds, outcome ranges, and the assumptions that drive the model.
Return to a focused daily dashboard for race context, odds, control visuals, and the evolving 2026 picture.
Study real elections through state and county results, candidate totals, and historical map views that add context to today’s race.
Explore Democratic and Republican primary maps, candidate controls, and nomination paths with a more interactive lens.
Turn your election map into a visual you can save, send, or use to explain a scenario to someone else.
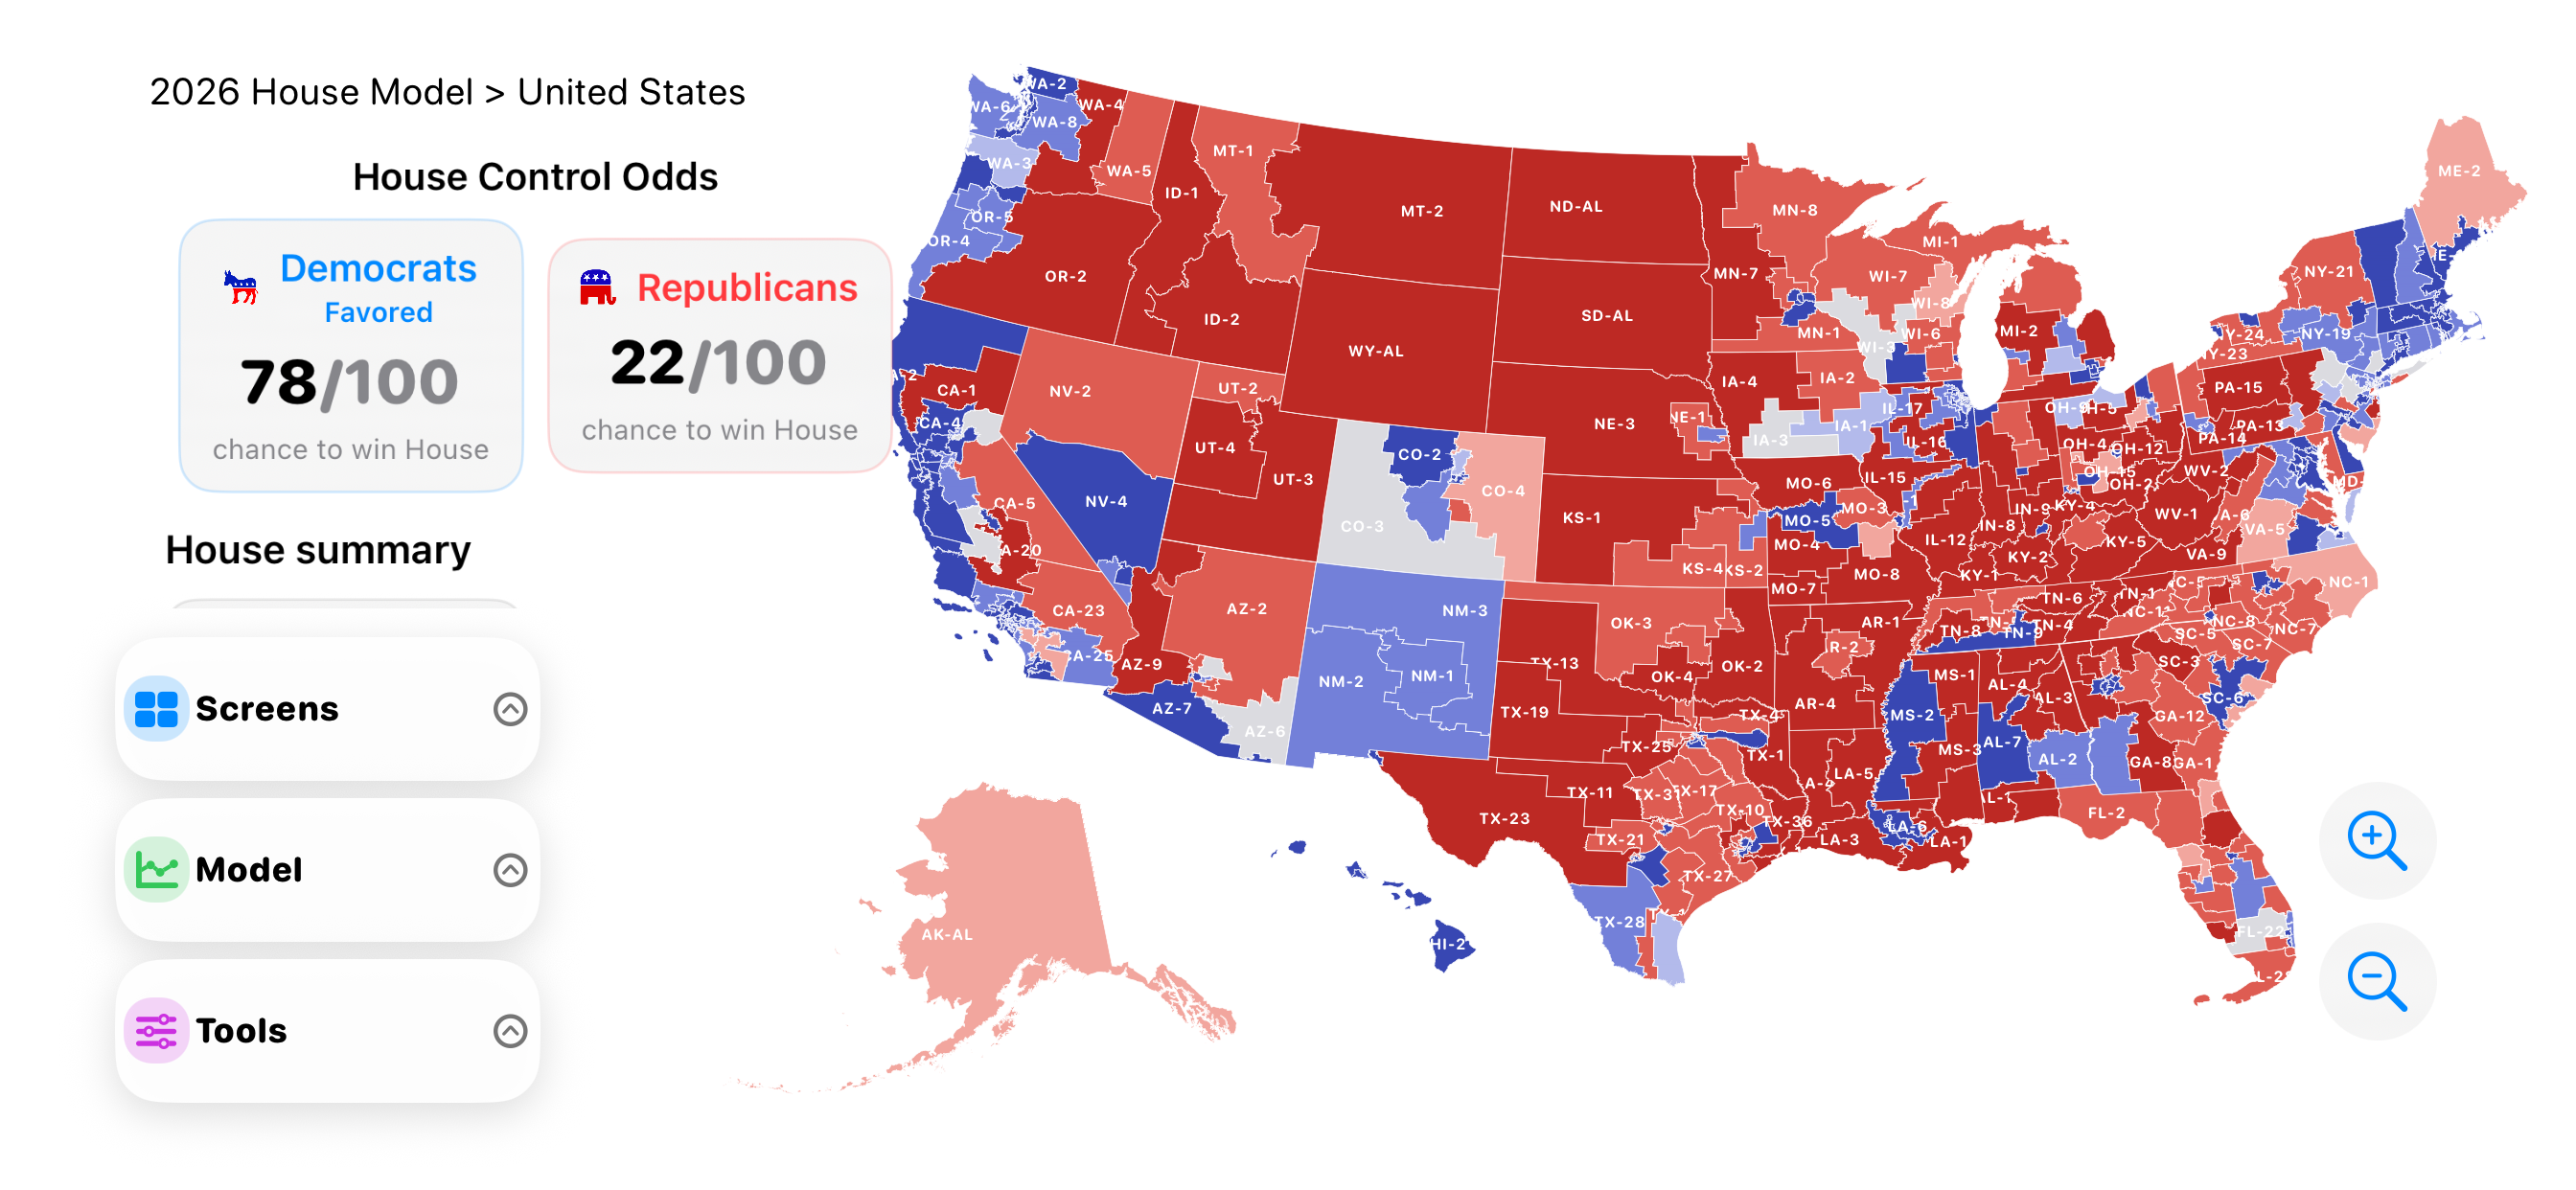
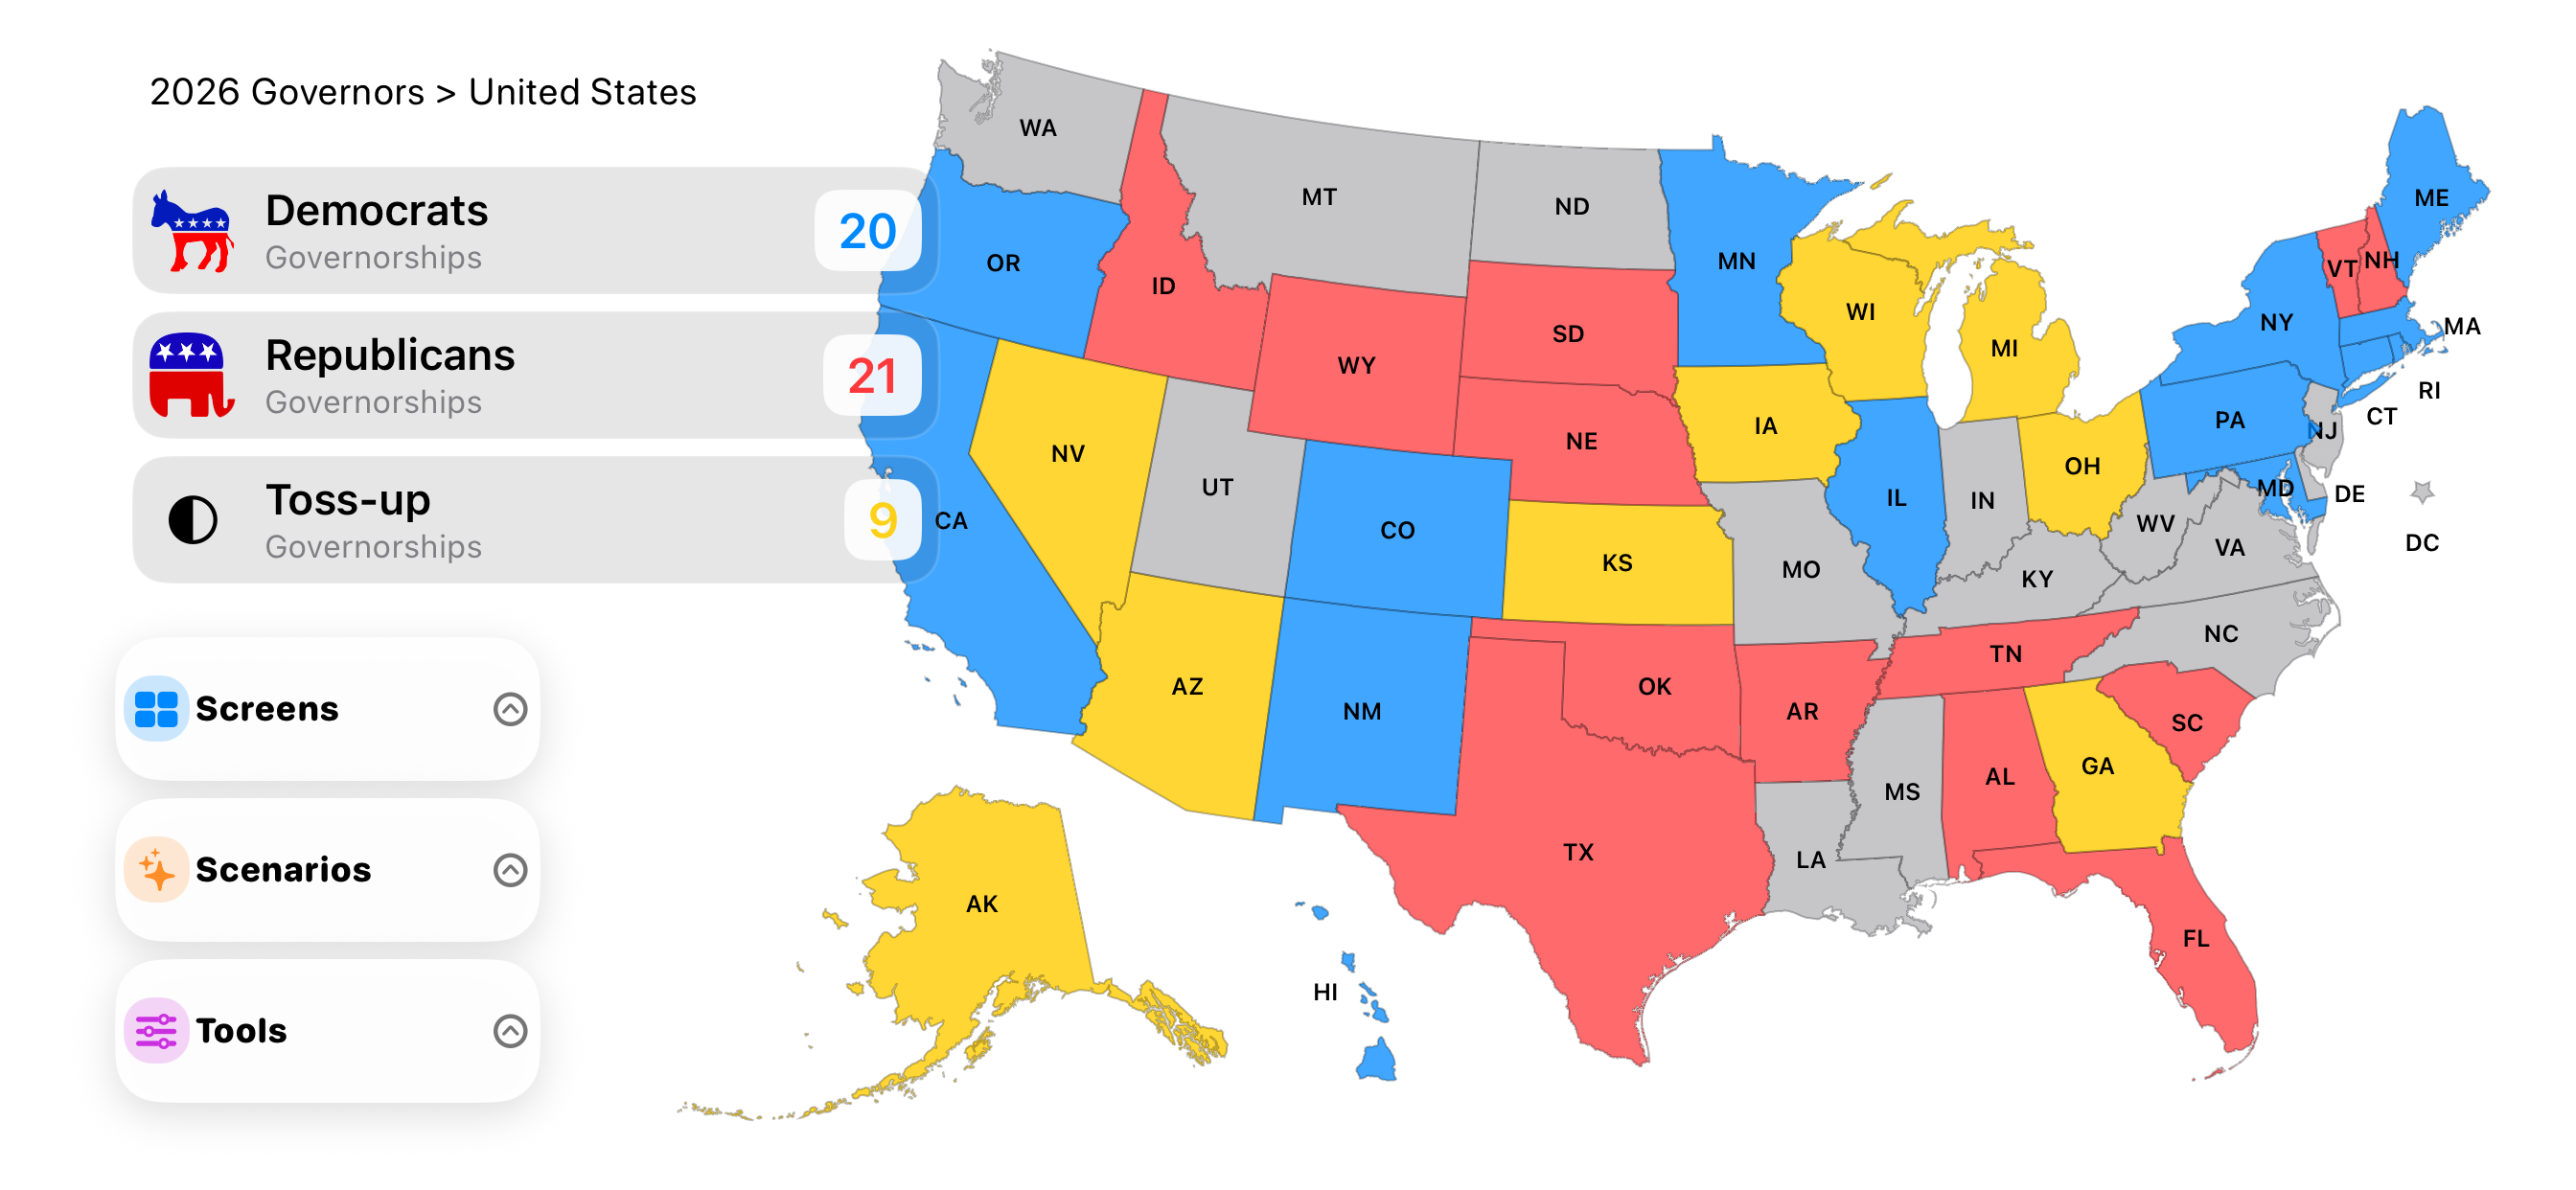
US Election Simulator is built for the way people actually follow a long election cycle—sometimes for one minute, sometimes for an entire evening. The app supports both quick map checks and deeper scenario work across portrait and landscape device layouts.
Get oriented quicklyScreen navigation, readable menus, and breadcrumbs help you know where you are.
Keep the map closeZoom, pan, tap, reset, save, and share without turning a simple question into a workflow.
Stay with the ideaHelp and rules screens explain the tools when you want a little more context.
Whether you are teaching civics, modeling possibilities, following your state’s race, preparing for election night, or simply trying to understand why the map changed, this is a space for examining the assumptions yourself.
Make the national picture tangibleStart with the map and move toward the races that catch your attention.
Explore probabilities, not just conclusionsUse models to understand uncertainty and the paths that could lead to control.
Give the current race some contextVisit historical maps and results when you want a longer lens.